Member performance dashboard
The performance dashboard provides metrics about a user’s annotation and review activities over a period of time, including how many tasks a user has completed and how quickly.
This can be useful in a number of ways:
- Resource management optimization: If you have a project that is on a rigid timeline, you can determine which users have the quickest turnaround and assign them as necessary.
- Annotator payment management: If you are using outside contractors or otherwise paying users based on their output, you can use this dashboard to help calculate or verify contractor payments.
- Reduce costs associated with internal analytic reports: With this report, you no longer need to develop complex tools or workflows to track user performance.
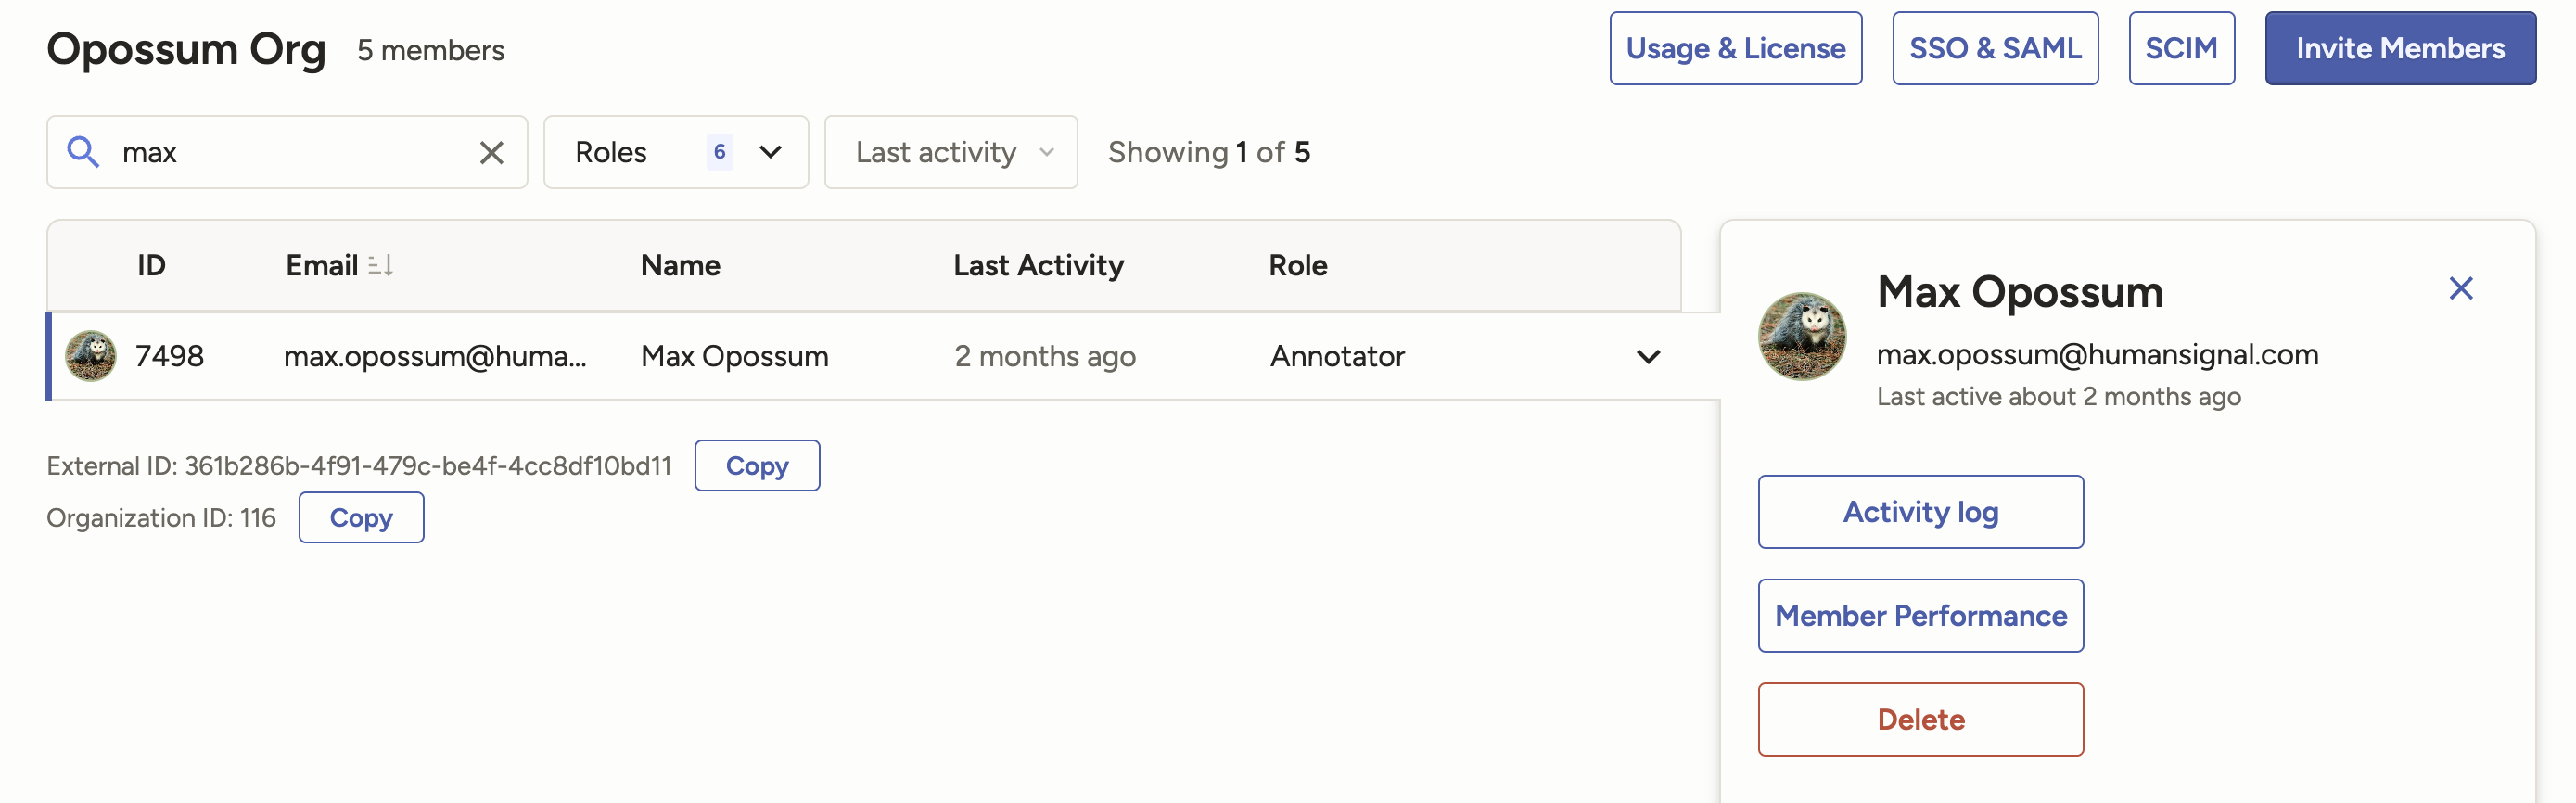
Access the dashboard
Depending on your user role, you can access this dashboard in several ways:
From the Organization page, select a user on the Members page. Then select Member Performance on the right.
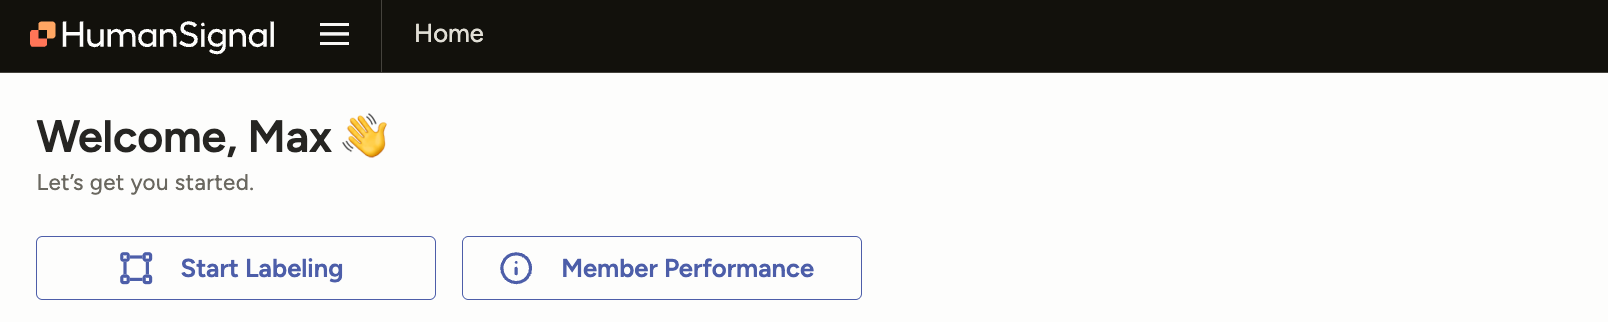
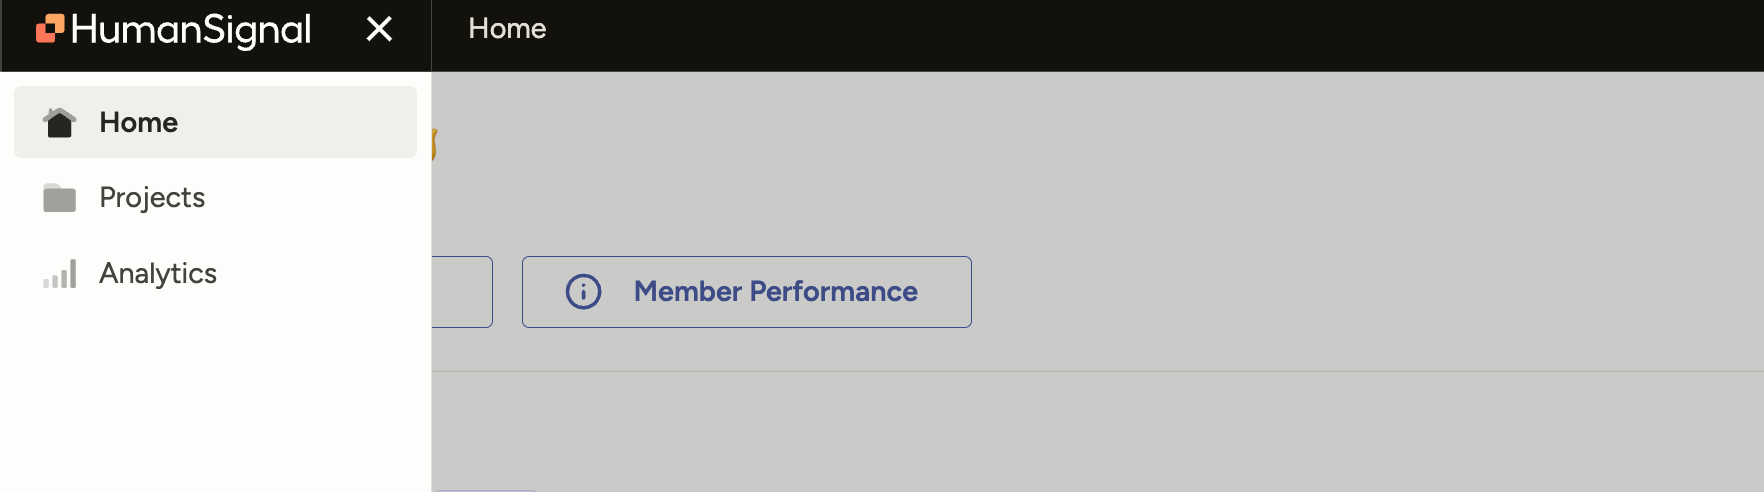
From the Home page, click Member Performance. This will pre-select your own performance dashboard.
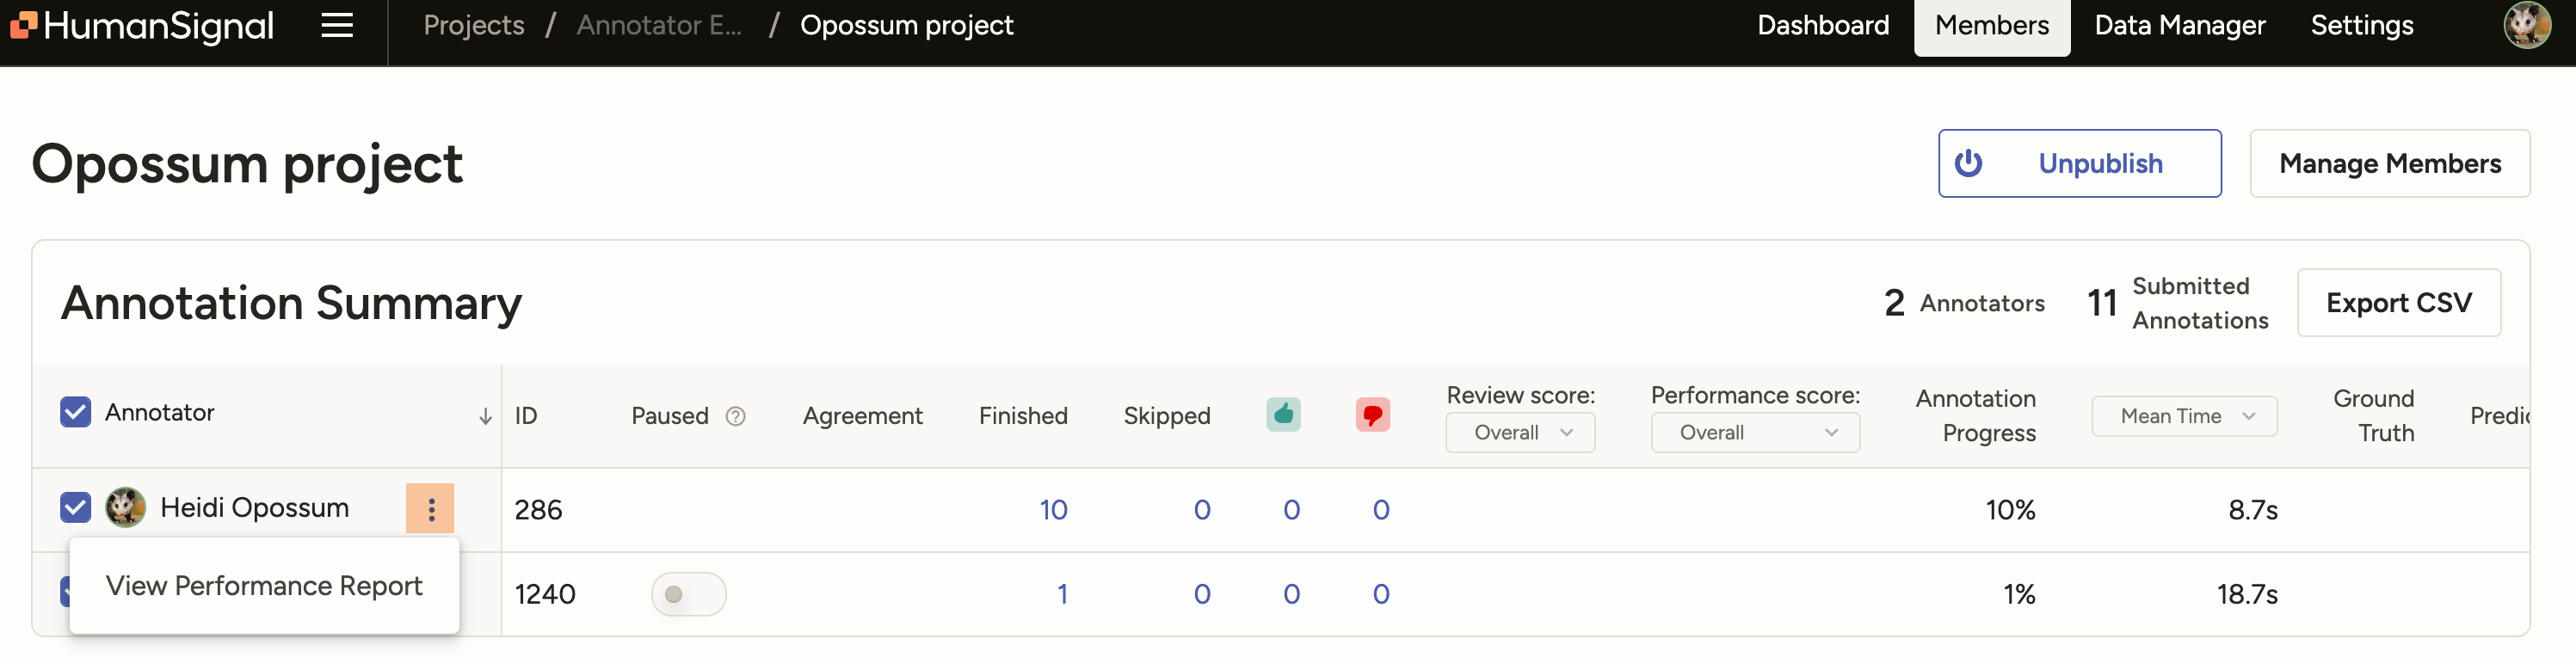
From the Members dashboard on a project, click the overflow menu next to a username in the Annotation Summary table. This will pre-select that user’s annotator performance dashboard for that specific project.
From anywhere within the app, open the navigation menu and select Analytics. This will pre-select your own annotator performance dashboard.
Access by user role
| User role | Access restrictions |
|---|---|
| Owner and Admin |
Can access from the navigation menu, the Organization page, the Home page, and the Members dashboard. Can filter for all users. Can filter for all workspaces. |
| Manager | Can access from the navigation menu, the Home page and the Members dashboard. Can filter for all users. Can only filter for workspaces or projects in which they are a member. |
| Reviewer and Annotator |
Can access from navigation menu and the Home page. Can only see their own annotation and reviewer history. Can only filter for workspaces or projects in which they are a member. |
Export data
You can use the Export drop-down to export the following:
Report - Download the information in the dashboard as CSV or JSON.
Timeline - Download a detailed timeline of all the user’s annotation actions within the time frame, including when the began and submitted each annotation.
Comments Added - Download a CSV file with all of the comments that the user has left.
Filter by date range
You can select a date range to apply to the performance metrics. If you want to be precise, you can also include time.
Note that annotation and review metrics are calculated on when they are completed, not when they begin.
For example, say you select a date range of 2 days: Monday and Tuesday. If an annotator opens an annotation on Tuesday, begins working on it, and then submits it on Wednesday, then that annotation and the time they spent on it will not be included in your performance report.
Similarly, if a reviewer opens an annotation on Tuesday but then doesn’t accept it until Wednesday, that annotation is not counted in their total reviews or accepted annotation metrics.
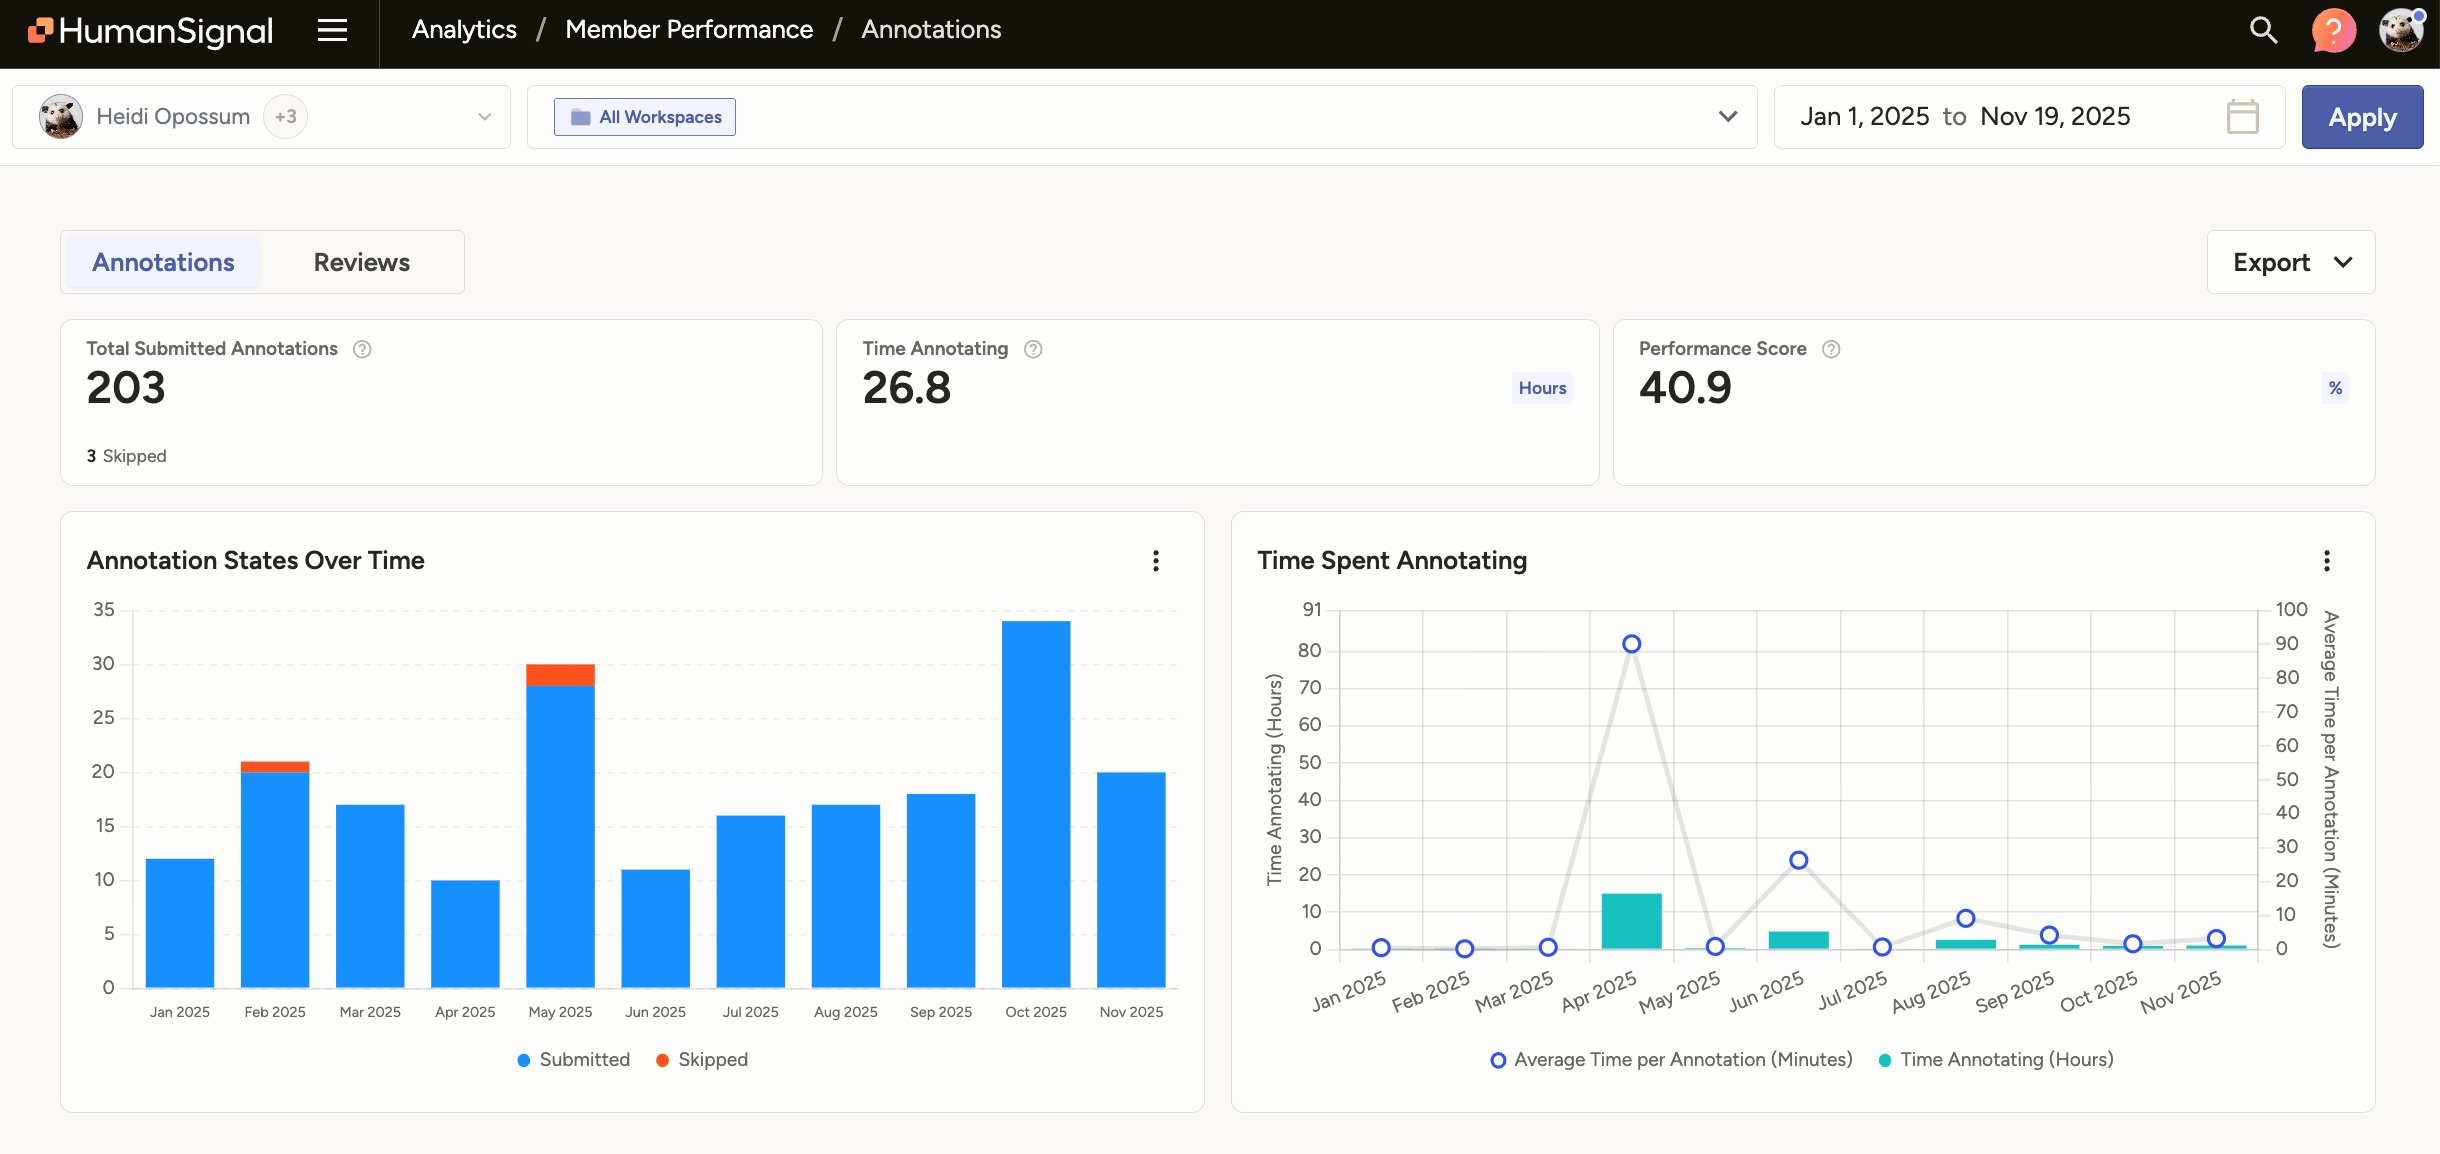
Annotations
The Annotations tab shows information related to a user’s annotation performance and history.
The metrics are calculated from the following data:
last_action– The last action taken on an annotation. This can can be submitted, updated, fixed and accepted, accepted, rejected.submitted_or_reviewed– Annotations that have a last action matching those listed above.lead_times– The time spent with annotations that have a last action matching those listed above. Lead time includes idle time and is cumulative across multiple sessions.
Annotation performance summaries
| Metric | Calculation | Description |
|---|---|---|
| Total Submitted Annotations | Sum of submitted_or_reviewed |
The total number of annotations the user submitted during the selected time frame. This includes annotations that have been submitted or updated, either reviewed or not. It does not include annotations that have been skipped. Note that each annotation is only included in their submitted count once. Label Studio does not count the same annotation twice based if it is later updated. |
| Time Annotating | Sum of lead_times |
The total time spent annotating during the selected time frame. This is calculated based on annotations that meet the criteria for submitted_or_reviewed. All annotations have a lead time. The lead time reflects how much time a user spent labeling from the moment the task was opened until they click Submit or Update. This includes idle time and time spent updating previously submitted annotations. The total time does not include time spent on annotations that have not been submitted and/or updated. For example, it does not include time spent on drafts or time spent on skipped annotations. Lead time is cumulative across sessions. That means if they leave or log out, and then return to an annotation draft or a previously skipped annotation, then their earlier time spent on the annotation is included when calculating their lead time. |
| Performance Score | Calculated from reviewer actions | The Performance Score reflects the overall performance of annotators in terms of review actions (Accept, Reject, Fix+Accept). The calculation is as follows:
|
Annotation graphs
| Graph | Description |
|---|---|
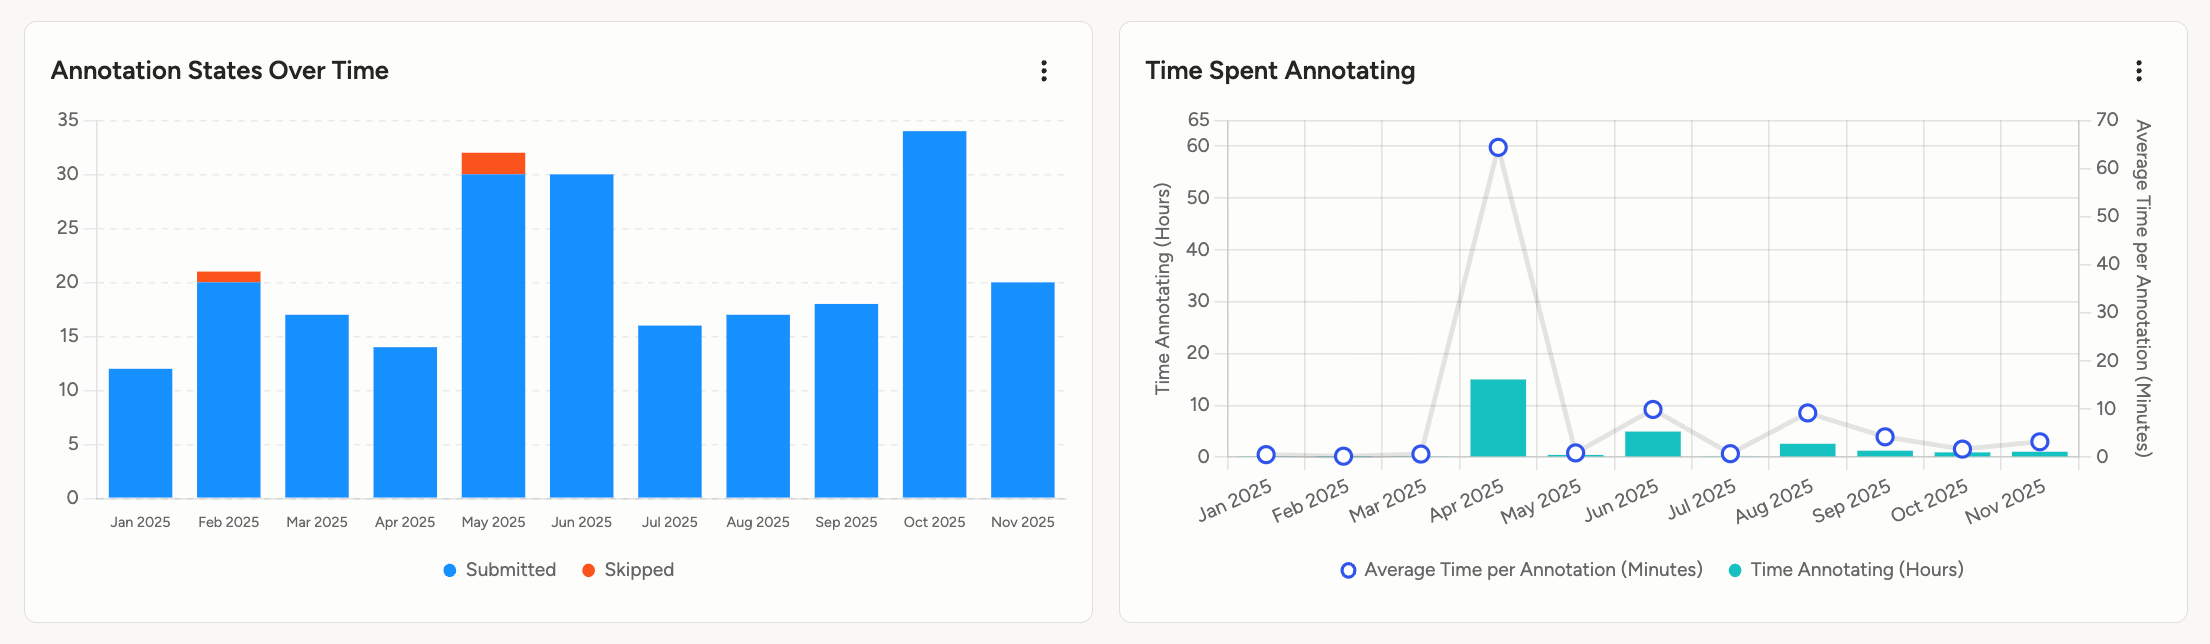
| Annotation States Over Time | A summary of all annotations completed by the user, segmented by date over the selected time period. |
| Time Spent Annotating | The time spent annotating (the lead time), segmented by date over the selected time period. This includes two metrics: The total time spent annotating in hours, and the average time per annotation in minutes. |
note
The date and time are calculated based on when they completed the annotation (see last_action above), and not when they began their annotation. See Filter by data range
Annotator performance table
This is a detailed table with performance metrics for each user.
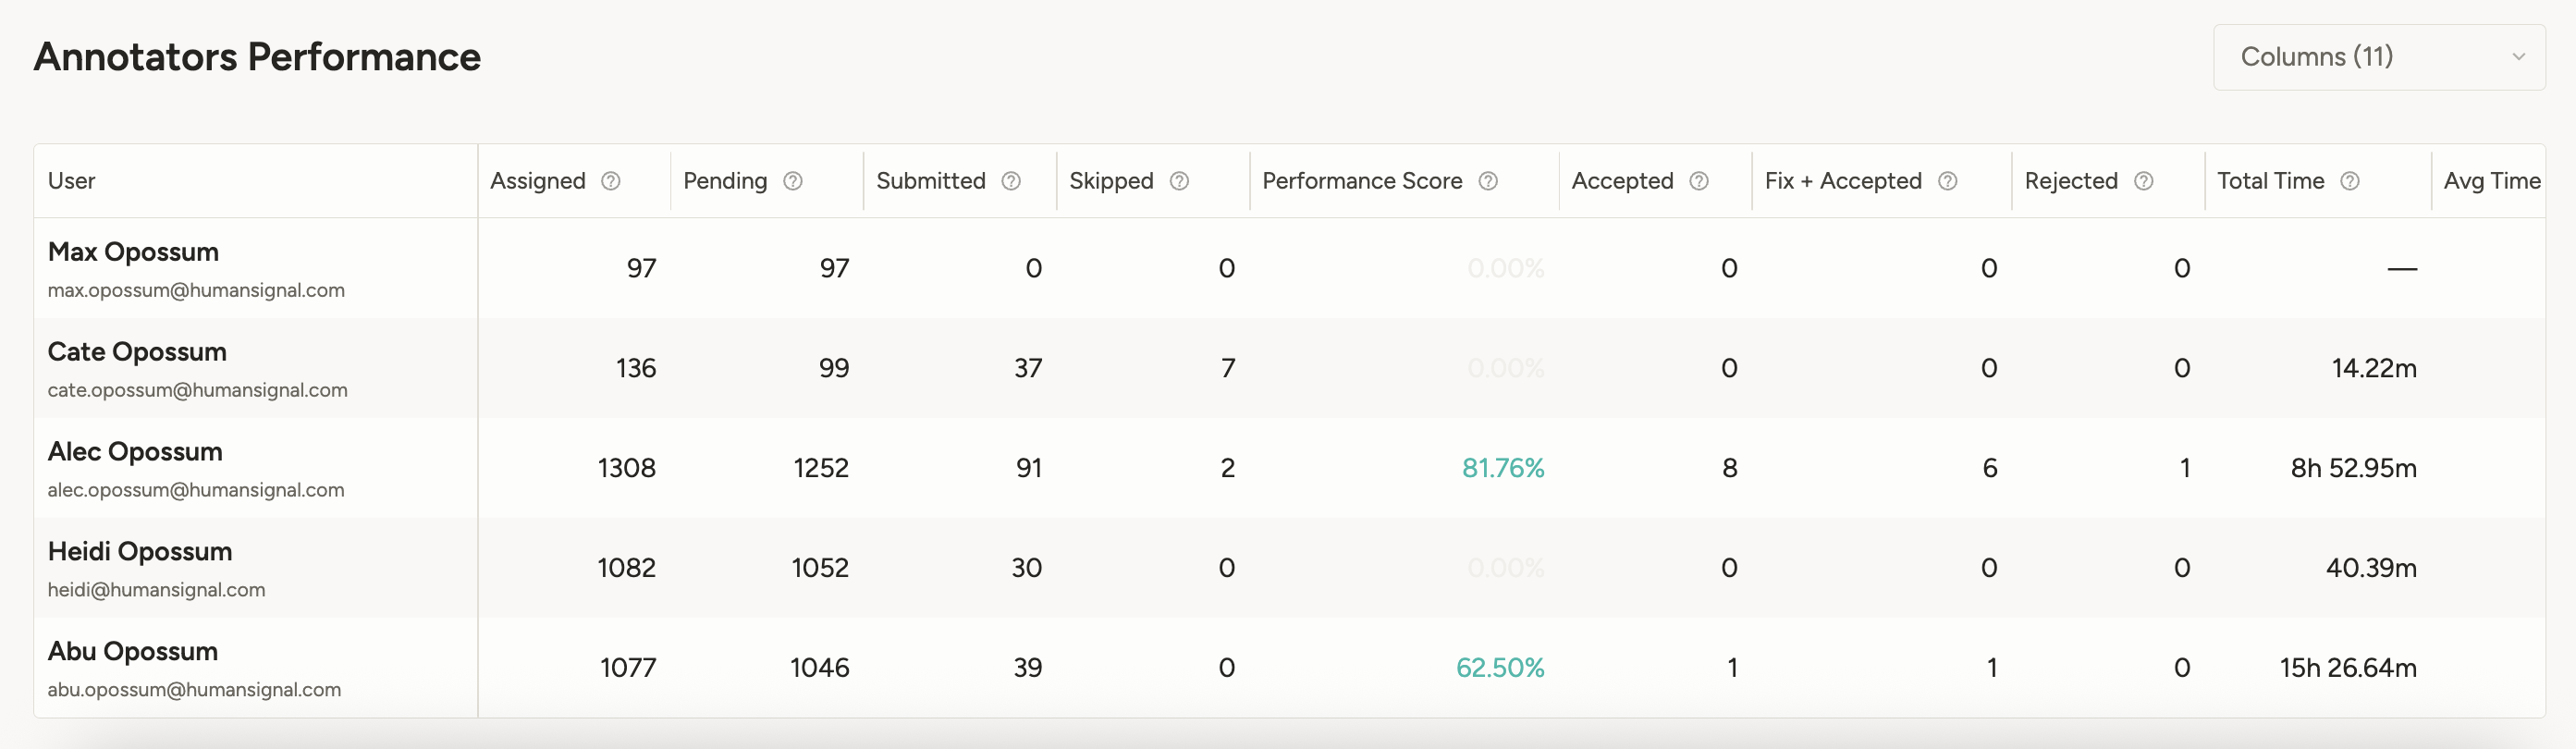
Keep in mind that all metrics in the table, including task assignments, are filtered by the time frame selected.
| Column | Description |
|---|---|
| Assigned | The number of tasks that have either been manually assigned to the user or have received a submitted annotation from the user. |
| Pending | The number of tasks manually assigned to the user, and for which they haven’t submitted an annotation and have not skipped. |
| Submitted | Number of submitted annotations. This includes annotations that have and have not been reviewed. |
| Skipped | Number of skipped annotations. |
| Performance Score | The performance score is calculated based on review actions on submitted annotations. See the table above for a complete description. If no annotations have been reviewed, this column is grayed out. |
| Accepted | Number of submitted annotations that have been accepted by reviewers. |
| Fix + Accepted | Number of submitted annotations that have been adjusted (fixed) by reviewers and then accepted. |
| Rejected | Number of submitted annotation that have been rejected by reviewers. |
| Total Time | The total time this user spent annotating (sum of lead_times). See the table above for a complete description. |
| Average Time | The average time spent on each submitted annotation (average of lead_times). |
| Median Time | The median time spent on each submitted annotation (median of lead_times). |
Reviews
The Reviews tab shows information related to a user’s activity reviewing other users’ annotations.
Review performance summaries
| Metric | Description |
|---|---|
| Total Reviews | Total number of annotations reviewed by the user. This includes all annotations that they have accepted, rejected, or updated and then accepted. |
| Time Reviewing | The total time spent reviewing. This is calculated from when a user opens an annotation to when they either take action on it (such as approving it) or close it by moving away from the task. This also includes idle time when the window is in focus. |
note
Data collection for review time began on September 25, 2025 for cloud environments, or for 2.30 for on-prem deployments. If you filter for earlier dates, review time will not be calculated.
Review graphs
| Graph | Description |
|---|---|
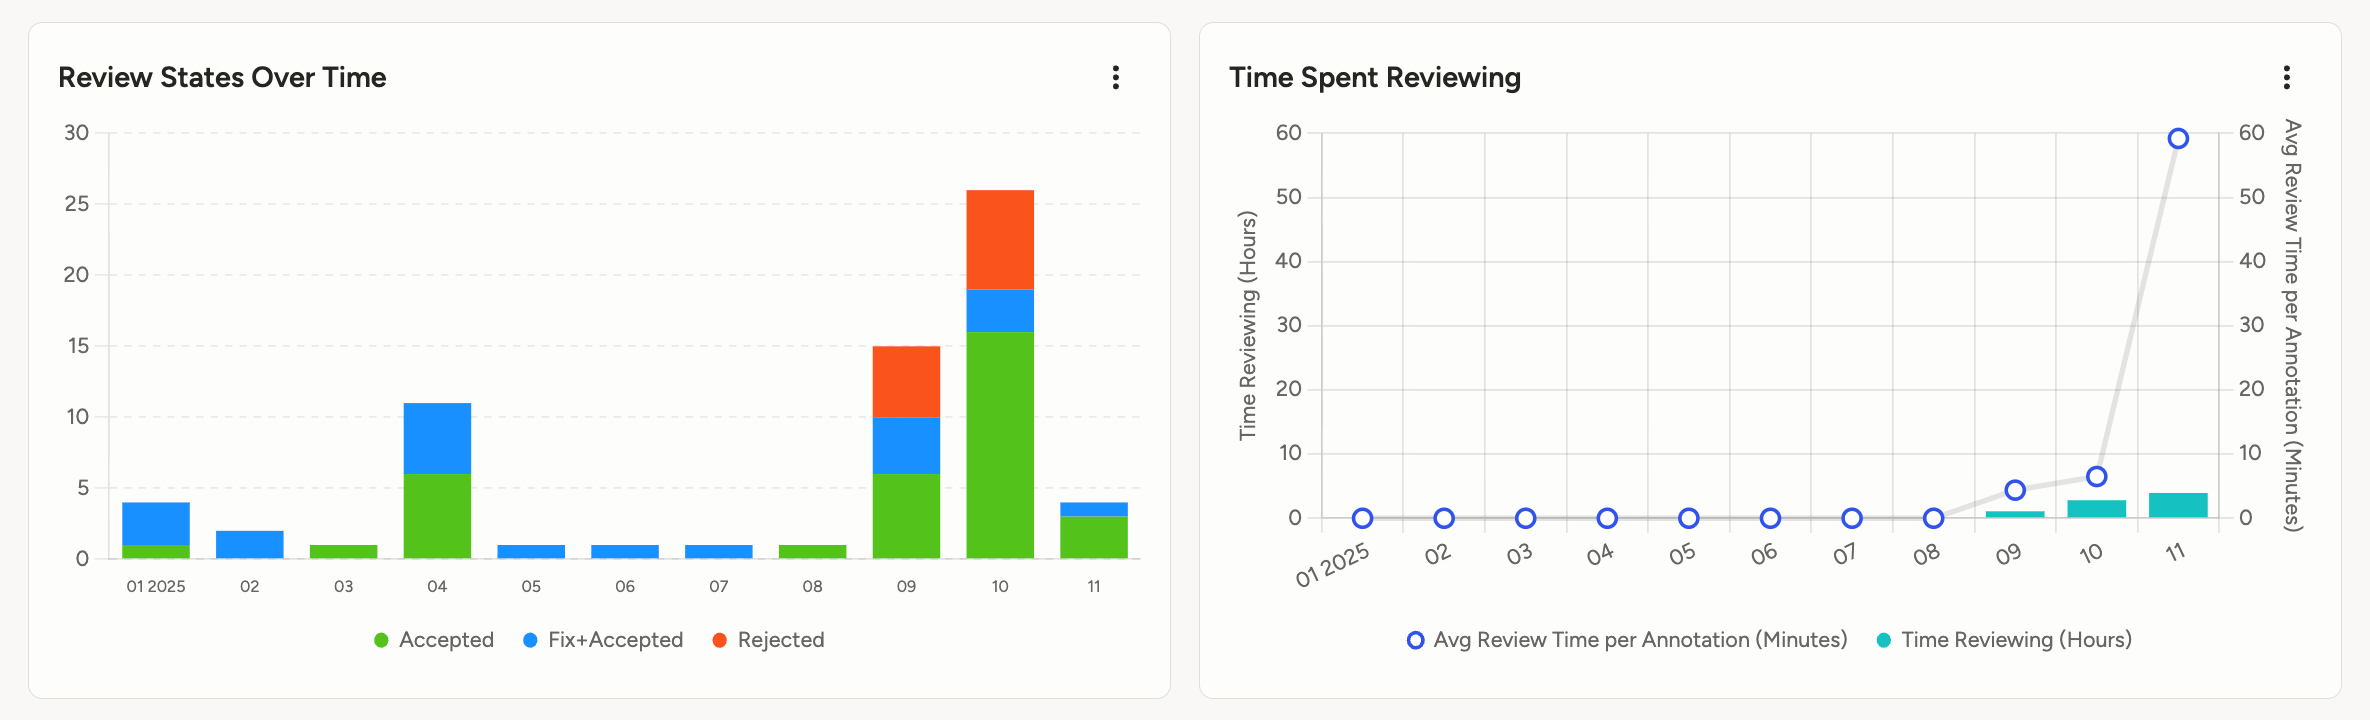
| Review States Over Time | A summary of all reviews completed by the user, segmented by date over the selected time period. |
| Time Spent Reviewing | The time spent reviewing, segmented by date over the selected time period. This includes two metrics: The total time spent reviewing in hours, and the average review time per annotation in minutes. |
note
The date and time are calculated based on when they either completed the review (such as by accepting it) or exited the annotation. See Filter by data range
Reviewer performance table
This is a detailed table with performance metrics for each user.
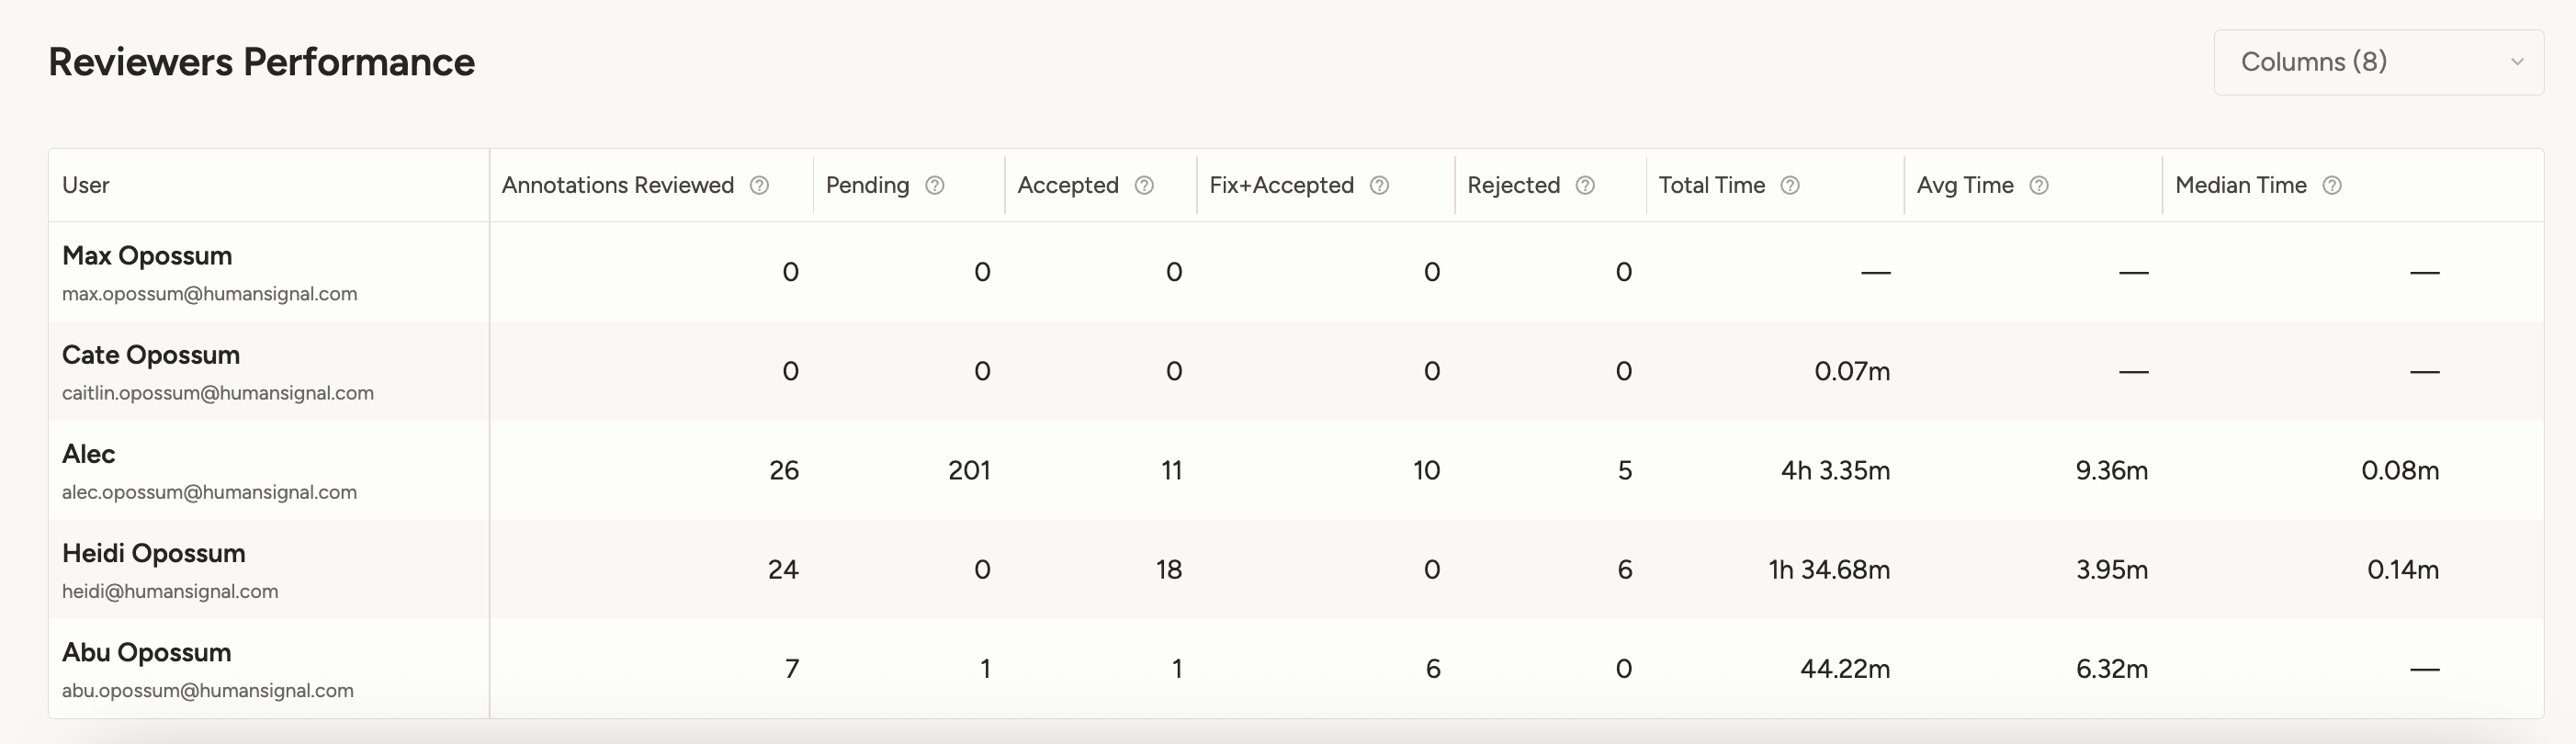
Keep in mind that all metrics in the table, including task assignments, are filtered by the time frame selected.
| Column | Description |
|---|---|
| Annotations Reviewed | The number of annotations that the user has reviewed. This includes all review actions (accept, reject, fix + accept). |
| Pending | The number of annotations that the user has been manually assigned as a reviewer and which have not yet received their review. |
| Accepted | Number of annotations the user has accepted. |
| Fix + Accepted | Number of annotations the user has updated and then accepted. |
| Rejected | Number of annotations the user has rejected. |
| Total Time | The total time this user spent reviewing. See the table above for a complete description. |
| Average Time | The average time spent reviewing each annotation. |
| Median Time | The median time spent reviewing each annotation. |